Enhanced TDS
Knowde-enriched technical product data sheet
Identification & Functionality
- Chemical Family
- Chemical Name
- CASE Ingredients Functions
- Industrial Additives Functions
- Technologies
- Product Families
Features & Benefits
- Labeling Claims
- CASE Ingredients Features
Applications & Uses
- Markets
- Applications
- Applicable Processes
- Coating Type
- Industrial Additives End Use
- Applications
• Batteries
• Supercapacitors
• Sensors
• Conductive Films
• Transparent Conducting Electrodes
• Electronics
• Functional Inks
• Composites
• Catalysis
• Fuel Cells
• Lubricants
• Anti-corrosion Coatings
• Antistatic Coatings
• Thermoelectric Devices
• Hydrogen Storage
• Water Filtration
• Environmental Remediation
• Rfid Antennas
• Structural MaterialsHow to Disperse Graphene
ULTRA Graphene can be dispersed in organic or aqueous solutions containing a surfactant by applying a mechanical force such as shear mixing, ultrasonic agitation or even ball milling. Solvents for the dispersion of ULTRA Graphene include: ethylene glycol, isopropanol, ethyl acetate, chloroform, DMF, NMP, THF, and dichlorobenzene. To get the best results, we recommend that our customers disperse ULTRA Graphene powders using concentrations up to 0.5 mg/mL, probe sonicate or shear mix the solution for 15 minutes, and centrifuge to remove the large particles.
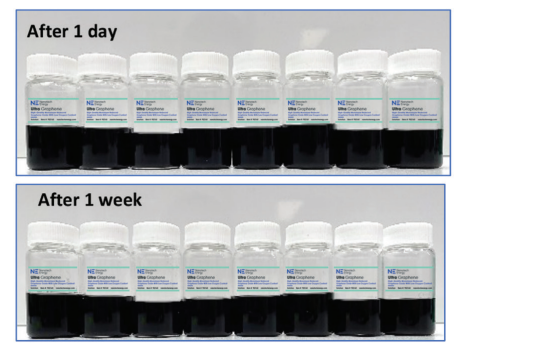
From left to right, dispersions of ULTRA Graphene in ethylene glycol, isopropanol, ethyl acetate, chloroform, DMF, NMP, THF, and dichlorobenzene at 0.1 mg/mL. The dispersions show excellent stability over time even when tested after one week.
Properties
- Color
- Physical Form
- Appearance
- Fluffy black powder
- Odor
- Odorless
- Insoluble in
- Water
- Typical Properties
Value Units Test Method / Conditions Manufacturing Method Reduction of GO - - Carbon Content (XPS) 96.5 % ISO standard: ISO_TS_21356-1_2021 Oxygen Content (XPS) 3.1 % ISO standard: ISO_TS_21356-1_2021 Ash Content max. 0.5 % ISO standard: ISO_TS_21356-1_2021 Surface Area (BET nitrogen) 887 - 1015 m²/g ISO standard: ISO_TS_21356-1_2021 Electrical Conductivity 3000 - 4000 S/m ISO standard: ISO_TS_21356-1_2021 Apparent Density (Tapped) 0.0015 - 0.0030 g/cm³ ISO standard: ISO_TS_21356-1_2021 Particle Size Distribution Of Bulk Powder (D10) 7.09 µm Horiba LA-960N laser scattering particle size analyzer. Particle Size Distribution Of Bulk Powder (D50) 12.1 µm Horiba LA-960N laser scattering particle size analyzer. Particle Size Distribution Of Bulk Powder (D90) 19.3 µm Horiba LA-960N laser scattering particle size analyzer. Lateral Size of rGO Flakes (D10) 0.2 µm SEM of a rGO film Lateral Size of rGO Flakes (D50) 0.36 µm SEM of a rGO film Lateral Size of rGO Flakes (D90) 0.65 µm SEM of a rGO film
Technical Details & Test Data
- Technical Analysis
Elemental Analysis
Description Value Unit Carbon (Weight) 85 - 88 % Hydrogen (Weight) 0.7 - 0.9 % Nitrogen (Weight) max. 0.3 % Oxygen (Weight) 2 - 6 % From elemental analysis, oxygen content of ULTRA Graphene goes further down to ~5 wt%, showing effective removal of most oxygen containing functional groups from graphene oxide.
Raman Spectroscopy
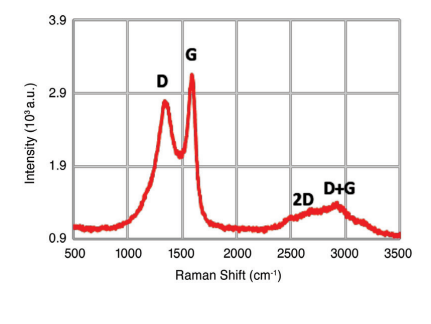
The Raman spectrum of ULTRA Graphene features the D band at 1350 cm-1, the G band at 1580 cm-1 and the appearance of the 2D band at 2690 cm-1 and the D+G band at 2900 cm-1 after the reduction of GO verifying the recovery of sp2 conjugation in ULTRA Graphene.
XPS Analysis
The purity of ULTRA Graphene is further demonstrated from XPS analysis, showing the dominance of carbon (96.5 at%) with small content of oxygen (3.1 at%). The high-resolution C1s spectrum of ULTRA Graphene confirms the recovery of sp2 carbon (68.8%) in comparison with sp3 carbon (7.4%), C-O (7.2%), C=O (2.3), and O-C=O (9.4%).
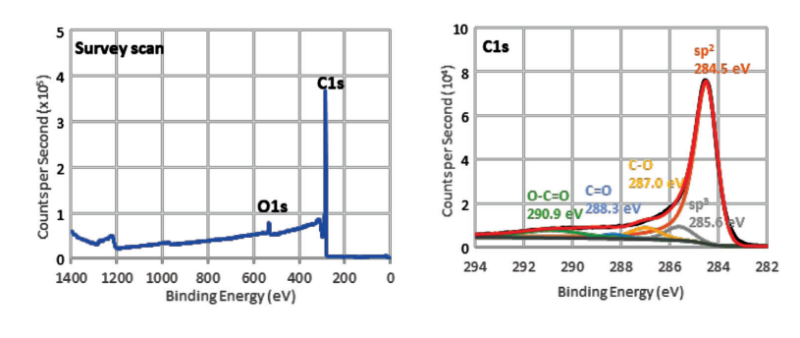
C Species Peak BE (eV) Percentage (%) sp2 284.5 68.8 sp3 285.6 7.4 C-O 287 7.2 C=O 288 2.3 O-C=O 290.9 9.4 X-ray Diffraction
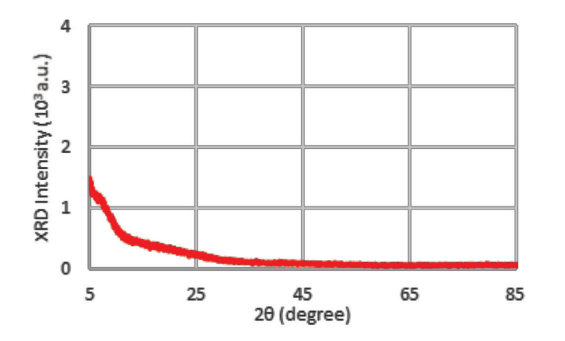
The powder XRD pattern of ULTRA Graphene is featureless across the spectrum range (5-45°), confirming the true exfoliated monolayer nature of the material.
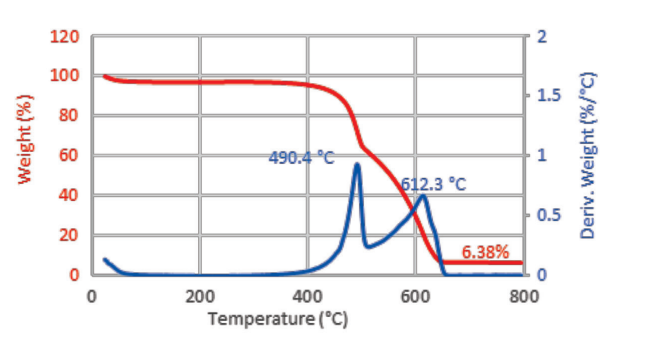
Thermal Analysis
ULTRA Graphene is stable against heat in AIR at temperatures approaching 500 °C, undergoing complete combustion at about 490 and 610 °C.
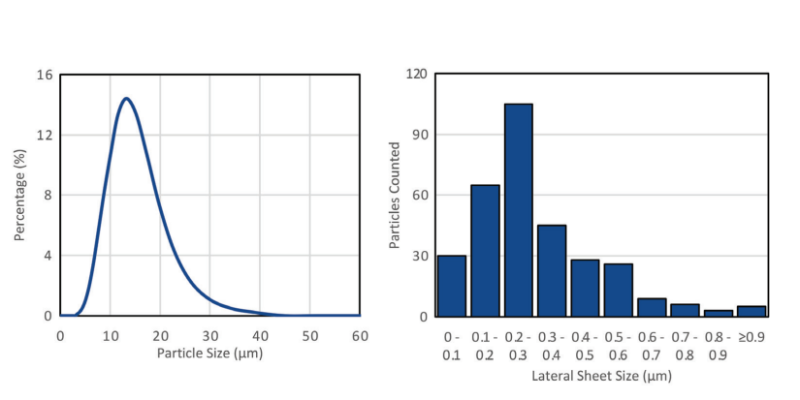
Size Distribution
The particle size distribution of the ULTRA Graphene bulk powder was measured using a Horiba LA-960N laser scattering particle size analyzer, showing D10 of 7.09 µm, D50 of 12.1 µm, and D90 of 19.3 µm. When dispersed into various polar solvents, ULTRA Graphene can resume the individual nanosheet state and uniformly casted onto various substrates, exhibiting the flake size distribution with D10 of 0.20 µm, D50 of 0.36 µm, and D90 of 0.65 µm.
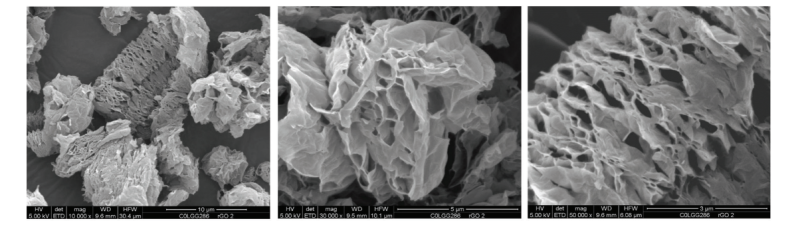
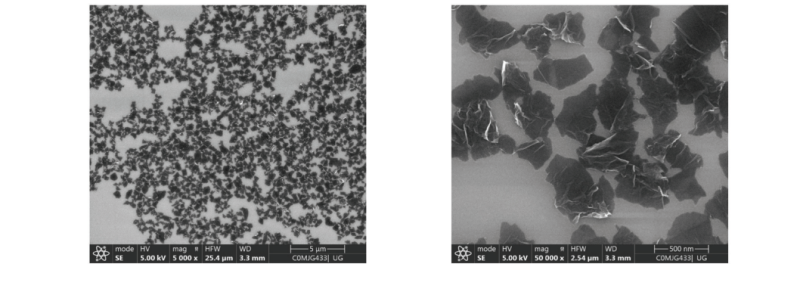
SEM Imaging (Bulk Powder)
Ultra Graphene powders under SEM exhibit a foam-like structure that is fully expanded and made of individual graphene nanosheets. Because of its unique structure, the material demonstrates remarkable surface area and electronic conductivity.
SEM Imaging (Dispersed Nanosheets)
After dispersing into solution, ULTRA Graphene can be casted onto various substrates with little to no restacking due to the “unflatness” of the graphene nanosheets.
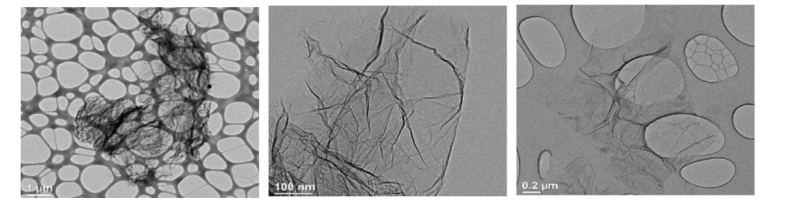
TEM Imaging
TEM images of the graphene powder (without liquid solution processing) reveal the individual graphene nanosheets, the basic building blocks that make up the 3D framework of ULTRA Graphene. Although the dry particles are made up of hundreds of graphene sheets, the particles (image on the left) appear transparent to the electron beam, again confirming the well-separated graphene sheets in the product. This was made possible through the introduction of massive wrinkles and ridges in the basal planes of graphene. This unique structure prevents the collapse and restacking of graphene sheets under the influence of van der Waals interactions.
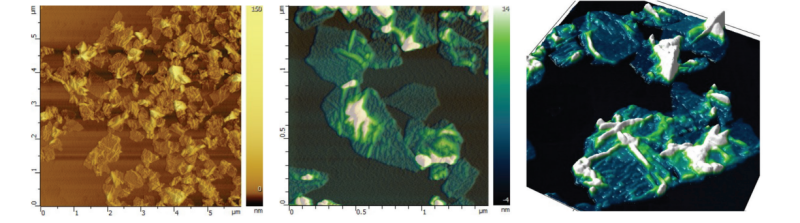
AFM Imaging
AFM provides additional confirmation for the SEM and TEM results. A graphene film coated onto freshly cleaved mica shows the numerous wrinkles and crumpling in the basal planes of graphene, which again contribute to the higher surface area of the material.